Introduction to TE Reporting
Get a deeper understanding of your institution. TE Reporting gives you the tools you need to analyse data for your institution in one place.

Welcome to TE Reporting
👋 Welcome to TE Reporting
We're excited to have you as a user! The purpose of this Knowledge Base is to provide you with all the information you need to make the most out of the tool.
To get started with the knowledge base, please navigate to any of the pages below:
TE Reporting Introduction Data Sources & Workflows
TE Reporting Viewing & Editing Reports
TE Reporting Creating & Editing Dashboards
Logging in to TE Reporting
Logging in to TE Reporting
Once you have your username and password all you have to do to login is to:
1. Go to reporting.timeedit.com
2. Enter your username (email address) in the text field and click 'Next'
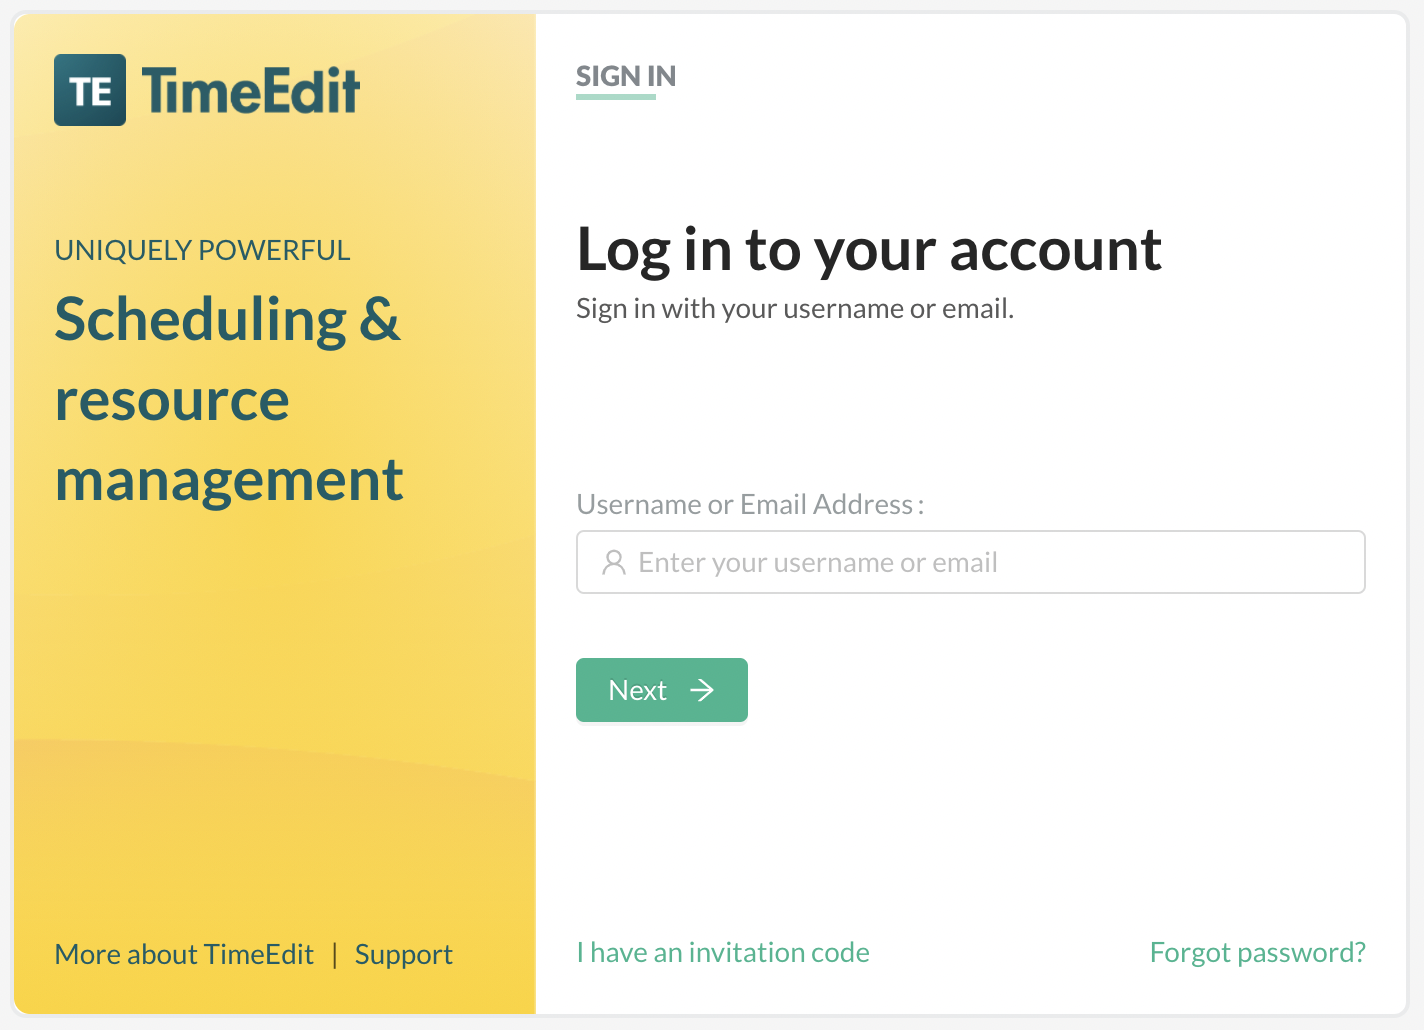
3. Enter your password and press 'Sign in'
4. If you have entered the right credentials, you will now be taken to the TE Reporting start page
The Fundamentals of TE Reporting
The Fundamentals of TE Reporting
TE Reporting consists of 4 key concepts:
- Data sources
- Workflows
- Reports
- Dashboards
The aim of the remaining of this article is to give a brief overview of the various parts of TE Reporting and how they work together. If you're looking to dive deeper into any topic, follow the links to the separate articles
Data Sources
Data Sources
Data sources are the primary building blocks of TE Reporting. They control what data goes into the report. They tell the application some of the most fundamental parameters:
- Which type of input data to use (reservations, orders, exams, forms, sensor data)
- The input configuration for each respective input (which types and objects are you interested in, over what period of time, etc.)
You access the data sources by click the Data source icon in the right hand side menu
.png)
Data sources are powerful and flexible, and harnessing their power allows you to create advanced reports with easy. On the highest level, a data source contains:
- General settings (name, description, etc)
- One or many Inputs (reservation data, order data, etc)
Data source inputs
Data source inputs are preconfigured connectors to each available TimeEdit application. Depending on which package you have, you can access reservation data, order data, exam data, form data, and activity data.
One data source can contain multiple data source inputs. By default, each data source input will be fetched and outputted as separate report sheets, but you can easily merge, group and adjust the data using the Data Transformation tab in your workflow.
Data transformation in your workflow
Workflows
Workflows
If data sources answer the question WHAT should be in my report, the Workflow answers the questions HOW and WHEN.
A workflow contains all the instructions for TE Reporting to be able to create a report, including which data source to use, which transformations to apply, who to notify, and when to execute it.
You access the Workflow page by clicking the icon in the right sidebar:
.png)
Configuring a workflow consists of 5 steps:
- Select your data source and choose an output type (Excel report or dashboard widget)
- Configure your data transformation (optional)
- Depending on the output type, choose a report template (optional) or enter a widget configuration (mandatory if you have dashboard widget as your output type)
- Configure recurring, automated report generation (optional)
- Configure email notifications for successful and failed workflow runs (optional)
- View logs and data from all current and past workflow runs
Workflow runs
Workflow runs
A Workflow run is the terminology for each attempt at running a workflow and generating a report. You can access all the runs for any workflow under the 'Logs' tab in a workflow, where you'll be able to see in detail what TE Reporting has been doing under the hood, as well as easily access the generated report.
Every time you hit 'Run' in a workflow, refresh a widget, or a scheduled workflow is due, a new run is queued for that workflow. Depending on how many other reports are being generated at that time, your workflow will soon start processing. As soon as it's completed you'll be able to access the report.
Reports
Reports
Reports are the output of a workflow. They contain all the data from the inputs, processed according to the transformation function, and then outputted as either an Excel file or a dashboard widget.
You access reports by clicking on the corresponding icon in the right sidebar
.png)
The reports are grouped by workflow, so first select which workflow you want to view reports for, and then you'll be able to view all reports generated by that workflow.
For an Excel report, you'll be able to make use of TE Reporting's built-in Excel editor to make further customizations. To do this, simply click on a report and select 'Open' in the sidebar that comes up.
The Dashboard
The Dashboard
The first thing you'll see when you sign into TE Reporting is one of your Dashboards. Think of the dashboard as your own control center for all TimeEdit data. The dashboard lets you display widget type reports as charts that you can drag around, resize and rename.
If you have navigated to another page in TE Reporting, you can return to the Dashboard page by clicking this icon in the menu bar:
.png)
Each Dashboard is made up one or many Widgets, where a widget is simply a workflow with the output type configured as Widget. By clicking the 'Edit Dashboards' button you can access a sidebar to quickly configure new Dashboards, or add, remove or edit widgets in an existing one.
.png)
To view a different Dashboard, simply click the one you want to see in the sidebar, and the Dashboard page will reload and show you your selection.